

French ride hailing company gets structured and powerful product analytics set up for their passenger and driver apps
The Company
Allocab is France’s 1st service of instant booking of private drivers or moto-taxi. They are present in all major French cities, covering 100% of train stations and airports. The company aims to provide simple private transport solutions to make life easier for travellers and has already served 600,000+ satisfied passengers. Allocab has 2 mobile apps: for passengers - that allows users to plan trips, choose vehicles and book drivers at the best price in France, and for drivers - that allows drivers to find passengers, complete trips and track their income.
The Challenge
Allocab team used Google Analytics for analysing usage of their apps, but eventually they felt the need of a more powerful tool, as what they had wasn't enough for their goals.
To grow, the Allocab team wanted to understand:
Allocab decided to use Mixpanel for their product analytics. For this, they needed a comprehensive event data design and dashboards/reporting structure.
Our Solution
Allocab is France’s 1st service of instant booking of private drivers or moto-taxi. They are present in all major French cities, covering 100% of train stations and airports. The company aims to provide simple private transport solutions to make life easier for travellers and has already served 600,000+ satisfied passengers. Allocab has 2 mobile apps: for passengers - that allows users to plan trips, choose vehicles and book drivers at the best price in France, and for drivers - that allows drivers to find passengers, complete trips and track their income.
The Challenge
Allocab team used Google Analytics for analysing usage of their apps, but eventually they felt the need of a more powerful tool, as what they had wasn't enough for their goals.
To grow, the Allocab team wanted to understand:
- Users' behavior in both their passenger and driver apps
- Trip booking flow performance and drop offs
- Most popular trip and vehicle options
- Trip bookings and completion drivers
Allocab decided to use Mixpanel for their product analytics. For this, they needed a comprehensive event data design and dashboards/reporting structure.
Our Solution
We approached this project in 5 steps:
1) Defined key product metrics.
We started by delving into the product, examined the business model and the key features that contribute to delivering the value to the clients. We defined key product metrics and constructed a metrics tree. This powerful artefact showcases the company's North Star Metric and the relations between other product metrics. This helped discern which metrics require primary focus.

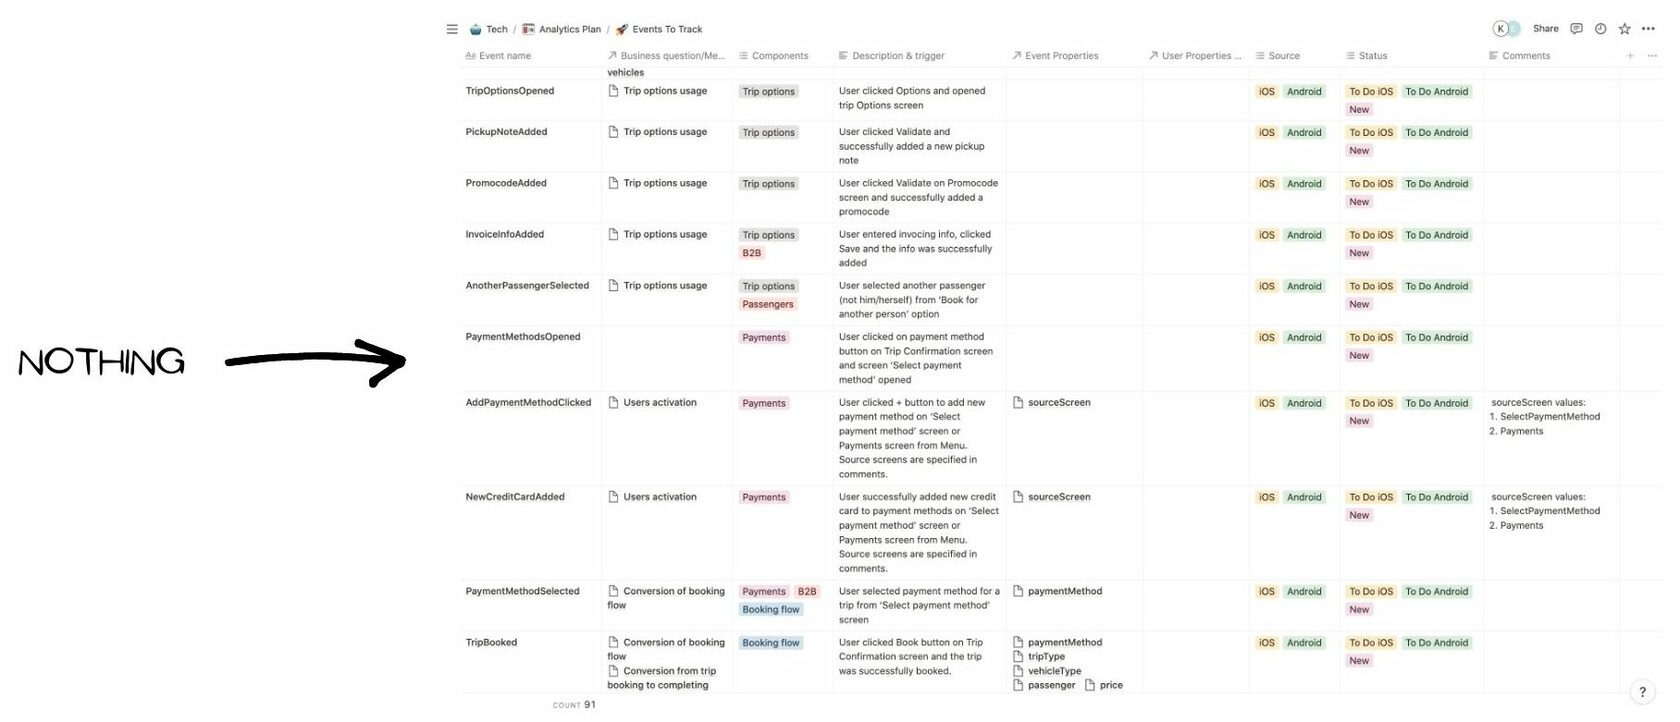
2) Planned data structure and created a tracking plan.
As a next step, we explored passenger and driver user flows and created the detailed tracking plan, using our own Notion template for product analytics. We created and documented around 100 analytical events with properties, focusing on crucial funnels, and core flows.
As a next step, we explored passenger and driver user flows and created the detailed tracking plan, using our own Notion template for product analytics. We created and documented around 100 analytical events with properties, focusing on crucial funnels, and core flows.
3) Guidance with the tracking implementation.
In close collaboration with the client's development team, we proceeded with the implementation of tracking following the best practices and made necessary configurations in Mixpanel.
4) Set up charts, dashboards, reports in Mixpanel.
After all the events were implemented and tracked, we configured chart, dashboards and reports in Mixpanel, visualising all the key product metrics. We also held a workshop to show the team members on how to work in Mixpanel to set them up for success in the long term.
5) Interpreted data, spotted interesting trends and provided insights.
The last stage was analysing the visualised data that helped address initial client's questions and requirements, with a particular emphasis on trip booking and trip accepting metrics.
The Outcome
Allocab’s product team were able to do their best work as they migrated from basic analytics to a comprehensive, structured, and clear product analytics and reporting. By helping Allocab set up Mixpanel analytics right, we guided them in becoming more data-focused.
✅ They became clear on the metrics they needed to focus on and what impacts them.
✅ Had product analytics implemented and visualisations in Mixpanel, making it easier to spot usage patterns of passenger and driver apps.
✅ Got data-informed answers to specific questions such as: "Where our users drop off most in the process of booking a trip? What are the most popular types of vehicles booked? What is the driver's trip acceptance rate?".
✅ Equipped for success as they set out to increase the conversion of their trip booking flow and trip acceptance rate of drivers.
20 May / 2023